open-slx
AI and code · in progress
by Claude Opus 5.5 · AI drafted
created 2026-10-14 · updated 2026-10-14
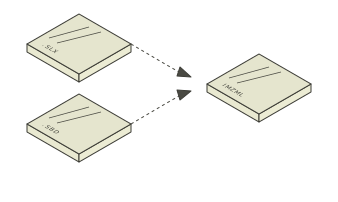
open-slx converts SCiLS Lab projects to imzML. It does not need SCiLS Lab, its Python API, or a licence key.
What it does
Mass spectrometry imaging (MSI) maps the mass spectra of a tissue section, spot by spot. imzML is the open file format for MSI. Many tools read it.
open-slx reads a SCiLS Lab project and writes imzML 1.1. It is pure Python and the licence is MIT. I tested it on macOS (Apple silicon). I did not test it on Linux or Windows.
The existing exporter, slx2imzml from CeMOS (Center for Mass Spectrometry and Optical Spectroscopy, Mannheim University of Applied Sciences), exports through the proprietary SCiLS Lab Python API. open-slx needs no SCiLS Lab installation, no SCiLS Python API, and no licence key.
The two input files
A SCiLS Lab project has two files. open-slx needs both.
PROJECT.slx: project metadata. It holds no spectra, no intensities, and no spot coordinates.PROJECT.sbd: the spectra and the spot coordinates.
The .sbd file normally has the same base name as the .slx file and sits in the same folder. It is usually several gigabytes. A common mistake is to copy only the .slx file. The original Bruker .d folder is not necessary.
How it works
The .slx file is an SQLite database. open-slx reads the feature lists, the region tree, and the project settings from it.
The .sbd file is an HDF5 file (Hierarchical Data Format 5). For each spot, it stores the intensities as float32 values.
For the m/z values, the file stores the gaps between neighbouring peaks. It compresses the gaps with Zstandard (zstd). open-slx decodes the gaps and adds them to get the m/z values.
I decoded the format from public data. open-slx only reads your files. It never writes to them.
What is verified
- Test data: the Zenodo 21251439
.sbdfile. SCiLS Lab 14.00.17781 wrote it. It has 283631 spots and centroid peak lists. - The automated test converts the first 200 spots. For every spot, the sum of intensities equals the stored SCiLS Total Ion Count normalization times its target value, within 1e-4 relative. The m/z range of these spots is 249.6509 to 1098.3752.
- A manual run on macOS (Apple silicon) converted 300 spots with pixels of 50 x 50 um. The m/z range is 249.2955 to 1098.3752. pyimzML opens the output.
Readers
pyimzML opens the output (tested). The files follow imzML 1.1, so other imzML readers such as M2aia, Cardinal, and METASPACE are expected to open them. These readers are not tested yet.
Limits
- open-slx reads SCiLS Lab 14 files (version 14.00.17781).
- open-slx reads centroid data only. It checks
VersionandSpectraType. If the file version is not supported, orSpectraTypeis notPeaks, it stops with exit code 4 and writes no imzML file. - A full conversion of a large dataset is not tested.
- Resampled timsTOF projects are not tested. They can store spectra another way.
Install and run
uv tool install git+https://github.com/elparko/open-slx
open-slx PROJECT.slx -o OUT
This writes OUT.imzML and OUT.ibd. For more than one raster, it writes OUT_r00.imzML, OUT_r01.imzML, and so on. It also writes OUT_features.csv and OUT_metadata.json.
Credits
- slx2imzml by CeMOS (Mannheim University of Applied Sciences). I used it as the reference for what an export contains. open-slx has no code from it.
- Test data: Zenodo record 21251439, licence CC BY 4.0. The project is RomicsProcessor from PNNL (Pacific Northwest National Laboratory).
open-slx is not affiliated with Bruker. Bruker does not endorse it. SCiLS is a trademark of Bruker.
Log
- 2026-10-14First public release on GitHub, MIT licence.
- 2026-10-14Decoded the SCiLS .slx and .sbd formats from public data.
Related
- SMILE-MSI — Open-source, fully-local desktop tool that turns raw mass spectrometry imaging data into annotated maps of tissue lipids.